Changes in the structure and geography of tourist flows during the COVID-19 pandemic
- DOI
- 10.5922/2079-8555-2023-1-8
- Pages
- 139-152
Abstract
Tourism suffered more than many other sectors amid Covid-19 travel restrictions. This article looks at the impact of the pandemic on the territorial redistribution of tourist flows in the Baltic region. The study draws on regional annual and monthly data on international and domestic tourist arrivals between 2019 and 2021, available on the websites of the statistical offices of the Baltic Region countries. The regions earlier dependent on tourist arrivals from Russia experienced the largest drop in inbound tourism during the Covid-19 pandemic. Yet, domestic tourism burgeoned in most of the region’s countries. In 2021, the most dramatic increase in domestic arrivals occurred, year on year, in the border regions of Russia’s Northwest Federal District; the growth was also notable in Finland and the Baltic States. Domestic tourist flow compensated, partially or even fully, for the decrease in inbound tourist flow in most regions. The structure of inbound tourism changed markedly during the pandemic, with the share of tourists from the Baltic States growing. The strongest rise was in some regions of southern Finland and more modest in Latvia and Lithuania.
Reference
Introduction
Tourism suffered much more than many other industries from the travel restrictions and other COVID-19 response measures. The bulk of studies exploring the effect of the pandemic on tourism tackle the problem at a global and national level. Much fewer works look at the changes in the geography of tourist flows. These changes, quite evident at the global level, require investigation at the level of groups of countries, individual countries and regions. In the Baltic region, the structure and geography of tourist flows altered during the pandemic.
In this study, the term ‘Baltic region’ is used predominantly in its narrow sense [1] to refer collectively to Denmark, Sweden, Finland, Estonia, Latvia, Lithuania, Germany’s five states (Schleswig-Holstein, Hamburg, Mecklenburg-Vorpommern, Brandenburg and Berlin) and Poland’s five northern voivodeships participating in the building of transboundary tourist and recreation regions on the Baltic coast. Yet, on the Russian side, the term is treated as covering not only the Baltic territories proper (St Petersburg, the Leningrad and Kaliningrad regions) but also three border regions of the Northwestern federal district (the Pskov and Murmansk regions, the Republic of Karelia), the latter included in the Baltic region ‘in a broad sense’.
This study aims to evaluate the effect of the COVID-19 pandemic on the spatial distribution of the tourist flow within the Baltic region.
To reach this aim, the following objectives are attained:
— identifying the regional patterns of change in the flow of inbound and domestic tourism in 2021, compared to 2020;
— assessing the role of domestic tourist flow in balancing the pandemic-induced drop in inbound tourism;
— calculating an indicator of change in the contribution of tourists from the Baltic region to inbound tourism in selected areas.
Materials and methods
This study is based on open access data from the statistical services of Finland,<1> Sweden,<2> Denmark,<3> Poland,<4> Estonia,<5> Latvia,<6> Lithuania,<7> Russia<8> and Germany’s states of Brandenburg, Berlin,<9> Mecklenburg-Vorpommern,<10> Schleswig-Holstein and Hamburg.<11>
Regional annual and monthly data on 2019—2021 international and domestic arrivals were used. For Sweden, where data on arrivals by region are not available, the number of overnight stays in the regions was considered along with the average number of overnight stays in the country.
The index of substitution of domestic tourism for the inbound flow was computed according to the formula:
|
ISdomtour= |
Tourdom2021– Tourdom2019 |
× 100%, |
|
Tourinb2019 |
where ISdomtour stands for the index of substitution of domestic tourism for inbound flows; Tourdom2021, for domestic tourist flow between July and September 2021, Tourdom2019, for domestic tourist flow between July and September 2019; Tourinb2019, for inbound flow between July and September 2019.
The period between July and September, the 3rd quarter of 2019—2021 seems to be the most indicative for two reasons; in that quarter, less tight restriction were in place in most European countries as incidence reduced, and the tourist industry was allowed to profits from the holiday season.
Another indicator of the contribution of Baltic region state to the structure of inbound tourist flow to selected areas is used in this study. It is calculated as follows:
|
IВinbTour= |
ΣTourinbBalt |
× 100%, |
|
Σtourinb |
where IВinbTour stands for the contribution of the Baltic region to the structure of inbound tourism; ΣTourinbBalt, for the total inbound tourist flow from Baltic region states; Σtourinb, the total inbound flow.
The index was calculated to cover the whole Baltic Sea region (in the ‘narrow sense’), with the exception of Russia since entry to EU countries was restricted to Russian citizens after March 2020 with the tourist flow from Russia decreasing to negligible amounts as a result.
The 2021-on-2019 reduction in the index is of particular interest as the structure of inbound tourist flows changed dramatically in spring 2020 after international travel restrictions had been imposed. In 2020, the amount of tourism between January and March often exceeded that in the remaining nine months. The structure of inbound tourist flows did not change significantly the next year: either in the first six months, when severe travel restrictions were in place in the study countries, or later, when tourism started to recover following the introduction of Green Passes that allowed vaccinated and recovered persons to cross borders and check into hotels without having to quarantine.
State of research
A large body of research on the impact of the COVID-19 pandemic on tourism has accumulated to date. In the first year of the pandemic, studies focused mainly on the losses incurred by the global tourism industry amid border crossing restrictions and lockdowns [2], [3], [4], [5], [6], [7]; in the second and third years, publications increasingly focused on changes in the amount and direction of international tourist flows began to appear.
Notable works have been published covering the situation in Romania [8], Moldova [9], Finland and Estonia [10], Kazakhstan and Uzbekistan [11]. One contribution [12] predicted a recovery in demand in 2021 for twenty tourist destinations around the world. Another noteworthy study was carried out by Polish authors who analysed the impact of the pandemic on inbound tourism across thirty European countries by computing the Perkal index using five UNWTO and Eurostat indicators calculated for 2020. [13].
There is a growing body of publications on the role of domestic tourism in the recovery of total tourist flows. Such studies have been conducted in Russia [14], Germany and Ireland [15], Italy [16], Turkey [17], [18], South Korea [19], New Zealand [20] and other countries. Mathematical methods are being increasingly used for this purpose. Post-pandemic tourist behaviour is another nascent area of investigation; studies with such a focus have appeared in Hungary [21] and South Korea [22]. Russian scholars have concentrated on the impact of the pandemic on the amount of tourism in the country by region. Several studies have looked at regions of the Northwestern federal district and their performance in 2020 [23], [24].
The aim and objectives of this prompt one to pay particular attention to the findings of studies into changes in the tourist flow and its geography at the level of regions. Most of these works concentrate on inbound tourist flows, for example, to the regions of Ireland [25], Great Britain [26], Norway [27], Estonia [28] Austria and Switzerland [11]. These investigations, however, use pre-pandemic statistics without considering the changes in tourism flows caused by
Covid-19.
For the first time, we addressed changes in the amount of tourism at the level of territorial units of the Baltic region when classifying cross-border tourism and recreational regions based on statistics from early 2019 to June 2021 [29]. It was observed then that the largest drop in tourist flows occurred in the first year of the pandemic in the cross-border tourism and recreational regions established with participation from Russia and Sweden. This study, in turn, will investigate the change in the amount and structure of tourism in the second year of the pandemic. It will also determine whether there was an increase in the domestic tourist flow, whether the inbound tourist flow begin to recover, and if so, in which parts of the Baltic Sea region.
Results and discussion
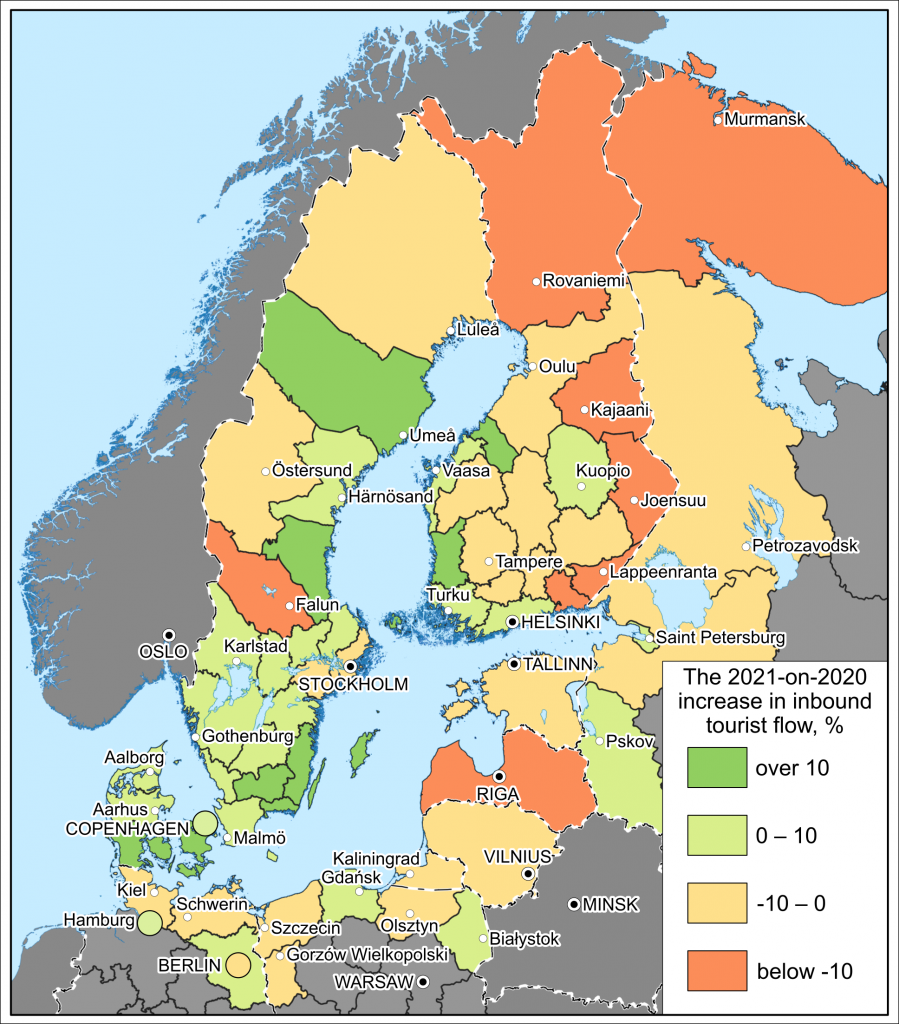
The first step towards identifying territorial differences in the recovery of tourist flows in the Baltic region was comparing the amount of inbound tourism in 2021 and 2020 (Fig. 1). These two years were selected as they provide a more accurate picture of inbound tourism recover than a comparison with 2019 levels, to which none of the study regions reverted in 2021, having experienced an over 50 % reduction in the inbound tourist flow.

|
| 1 |
| The 2021-on-2020 increase in inbound tourist flow, % (prepared by I. A. Ivanov) |
|
|
The territorial units where the decrease was the sharpest fall into two groups. The first one includes the countries and regions that had depended on tourist flows from Russia, namely, Latvia and the Finnish regions of Kainuu, Kymenlaakso, South and North Karelia. The second one comprises regions with a significant proportion of winter arrivals, all of them boasting major ski resorts. These are Finland’s Lapland, Sweden’s Dalarna and Russia’s Murmansk region. This choice is predicated on two factors. Firstly, the inbound tourism flows did not change much between January and March, with the decline beginning in the latter month, and a winter lockdown was imposed in 2021, making inbound tourism virtually impossible. The figures of the first three months of 2020 were never reached over the rest of the year due to the restrictions in place. Secondly, the reduction in international air travel, the preferred mode of transport for most ski resort visitors, was another negative influence.
The regions of the Gulf of Bothnia performed better than the others, with the amount of tourism growing in all Finnish regions except for North Ostrobothnia and all Swedish counties excluding Norrbotten. Inbound tourism did not recover that rapidly in most of the coastal regions, where the growth in absolute values was insignificant.
A positive trend was observed in the regions of South Sweden and Denmark, with the majority of arrivals coming from Germany. Yet, In Poland’s Lubusz and West Pomeranian voivodeships, where Germans also account for most of the international visitors, there was no such increase: these differences may be due to less tight COVID-19 restrictions than in Denmark and Sweden being in effect in Poland in summer 2020 (according to Oxford University’s stringency index<12>). In 2021, the differences in the stringency of restrictions were less profound, and, compared to 2020, Denmark’s and Sweden’s less tough restrictions led to a marked increase in inbound tourism (primarily from Germany).
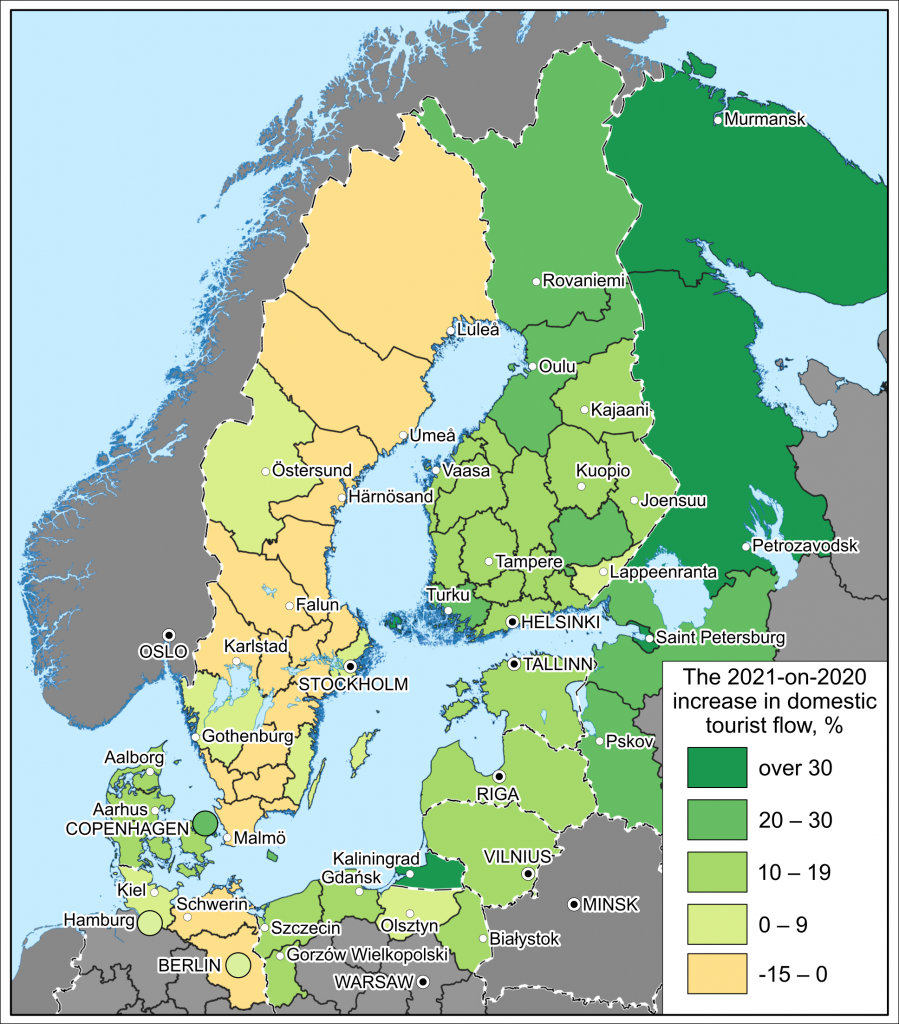
Amongst the Russian territories, only the Pskov region saw a rise in inbound tourist arrivals, but the increase in absolute values was small (9,000 arrivals in 2021 versus 8,000 in 2020).During the COVID-19 pandemic, domestic tourism grew in importance. Fig. 2 shows the 2020-on-2021 increase in domestic tourist arrivals. There are sharp contrasts in the patterns of domestic tourist flows: two German federal states (Brandenburg and Mecklenburg-Vorpommern) and most regions in Sweden saw a decrease in domestic tourism.

|
| 2 |
| Increase in domestic tourist flows in 2021, % of 2020 values (prepared by I. A. Ivanov) |
|
|
The highest rates of increase were in the border regions of Russia’s Northwestern federal district (most probably, due to the restriction for the Russians on travel to Europe). The Kaliningrad region, home to seaside resorts, benefited from the weather in summer 2021: the season was rainy on the Black Sea coast. In 2021, domestic tourism grew in all Finnish regions by over 10 %, the only exception being South Karelia, where the increase was lower. In the Baltics, Denmark and most Poland’s voivodeships, the growth was also above 10 % (excluding Warmia-Mazury).
In almost all the regions that experienced a dramatic drop in inbound tourism in 2021 the rise in domestic tourism was insignificant, or even a reduction occurred. This applies to the Finnish regions along the border with Russia, Latvia and Sweden’s Dalarna. The exception was Finland’s Lapland where domestic tourism grew by 30 %.
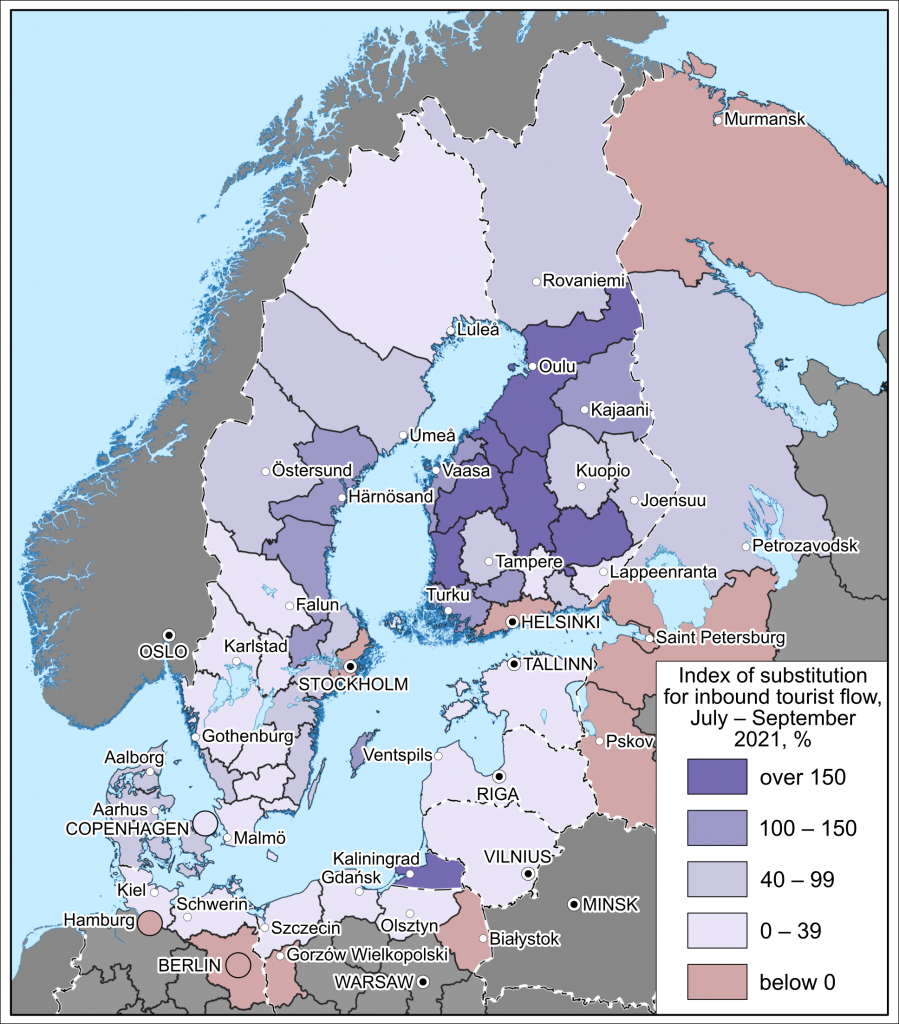
Figure 3 shows the index of substitution of domestic tourism for inbound flows in 2021 on 2019, calculated by the authors of this article.

|
| 3 |
|
Index of substitution of domestic for inbound tourism in between July and September 2021, compared to 2019 (prepared by I. A. Ivanov)
|
|
|
A rate of above 100 % means that not mere substitution but growth in the total tourist flow took place between July and September 2021 compared to 2019. This happened in most of the regions (except for some territories bordering Russia), some Bothnian territories and Russia’s Kaliningrad region. In the Baltics and in the regions on the southern coast of the Baltic Sea, the degree of substitution was rather moderate. In some of the regions, even a partial substitution of domestic for inbound tourism did not occur. A characteristic examples are the capital regions of the Baltic region countries, St Petersburg and Germany’s Hamburg and Brandenburg, all of them major pre-pandemic destinations for international tourists. This group also includes the Murmansk, Leningrad and Pskov regions, and two Polish voivodeships where the 2021 increase in domestic tourist flows failed to compensate for the decline in the first year of the pandemic.
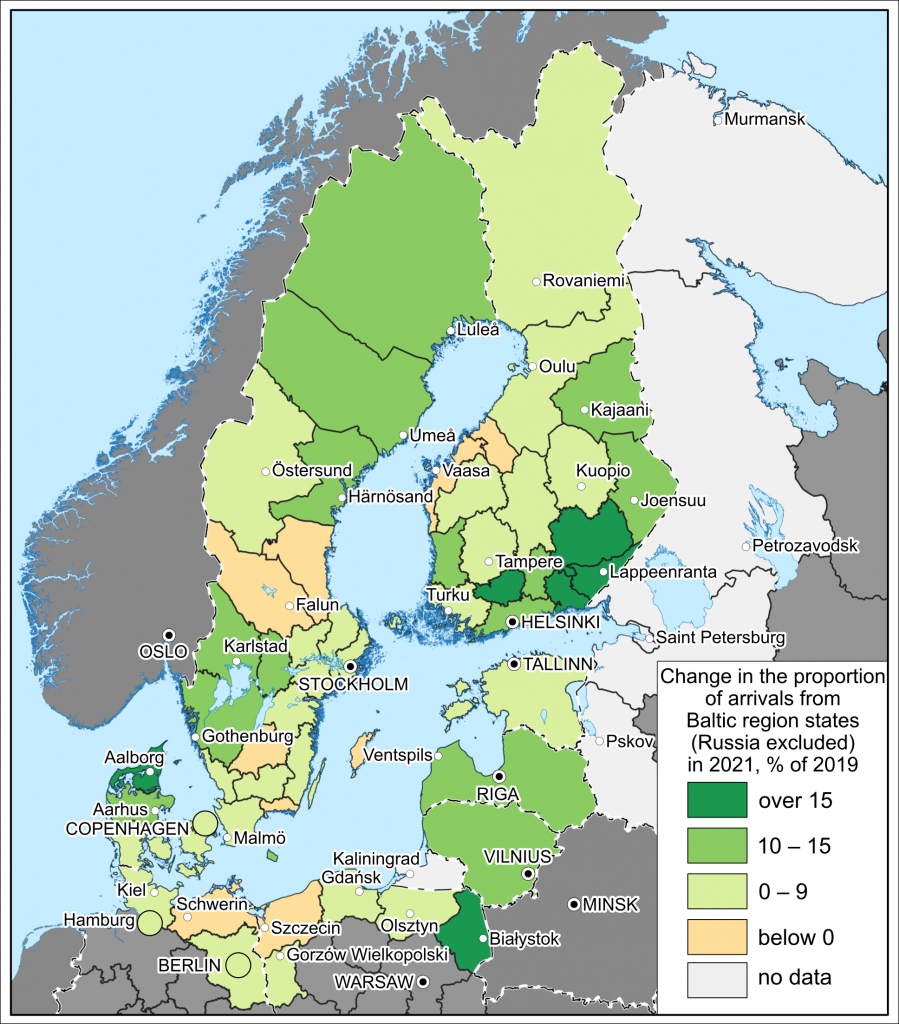
In 2021, the structure of inbound tourist arrivals underwent radical changes. Figure 4 shows variations in the proportion of arrivals from the eight countries of the Baltic Sea region in 2021 compared to 2019. Domestic tourist arrivals were factored out along with the figures for Russia, whose borders were closed during the study period. In contrast to the previous two analyses of tourist flow patterns, we chose 2019 as the base year since the year 2020 is not representative in terms of structure: January-March 2020 had the same structure of arrivals, whilst a drastic change occurred in the summer in most regions. And the structure of tourist arrivals was much more stable in 2021.
In most the study areas, the structure of inbound tourist flow experienced an increase in the proportion of arrivals from the Baltic region states, which points to a decrease in the average distance travelled by tourists. Against the background of plummeting inbound tourism, this proportion grew not following an increase in the tourist flow but as a result of a more modest reduction.
The most considerable growth took place in some southern regions of Finland (Kanta-Häme, Kymenlaakso, South Karelia and South Savo), Poland’s Podlaskie voivodeship and, to a lesser degree, in Latvia and Lithuania, which suffered a sharp decline in the number of tourists from Russia and the Republic of Belarus. The quantity of arrivals from the Baltic region states also grew in Sweden’s län bordering Norway as the number of visitors from the latter country dwindled. In some of the regions, the share of arrivals from the Baltic Sea region declined as a consequence of a significant decrease in the contribution of the formerly leading countries of origin. For southern Sweden and western Poland, such a country is Germany; for Mecklenburg-Vorpommern, Sweden (the Netherlands, which are located outside the Baltic region, became the de facto leader in this German federal state in terms of arrivals).

|
| 4 |
| Change in arrivals from the Baltic region (excluding Russia) compared to 2019 (prepared by I. A. Ivanov) |
|
|
Conclusions
This study revealed regional patterns in the 2021-on-2020 change in inbound tourism. The territories of the Baltic region that experienced the most drastic reduction in tourist flows were divided into two groups. The first one includes the countries and regions hat received that largest tourist flows from Russia; the second, those with a considerable proportion of winter arrivals (lockdown was imposed in the winter of 2021, rendering inbound tourism virtually impossible.
The highest rate of increase in inbound tourist flow compared to 2020 occurred in the regions of the Gulf of Bothnia due to a low initial amount of inbound tourism. A positive trend also developed in the territories of Denmark and South Sweden, where Germans accounted for most arrivals.
During the COVID-19 pandemic, most countries in the Baltic Sea region experienced an increase in domestic tourism. The most significant 2021-on-2020 growth in domestic tourist flows occurred in the border regions of Russia; the increase was also noticeable in Finland and the Baltic States. A reduction in domestic tourist flows took place in most Swedish regions and two German federal states (Brandenburg and Mecklenburg-Vorpommern).
An increase in domestic tourism in most regions partially or even fully balanced the drop in inbound tourism. The exceptions were the capital regions and some territories of Russia, Poland and Germany where the domestic tourist flow in 2021 did not revert to 2019 levels. This conclusion was made based on the index of substitution of domestic tourism for inbound flows from July to September 2021 compared to the same period of 2019.